Blackbox & Telemetry Analysis
How real flight data turned into concrete tuning decisions — including a methodology where an initial assumption was later corrected because a closer look at the data showed something else.
From blackbox log to FFT analysis
From a blackbox log with 5 chirp test flights, CSV exports were created via the official Blackbox Explorer — complete time series with ~8000 data points per second. From these, a frequency analysis (FFT) was calculated for each axis.
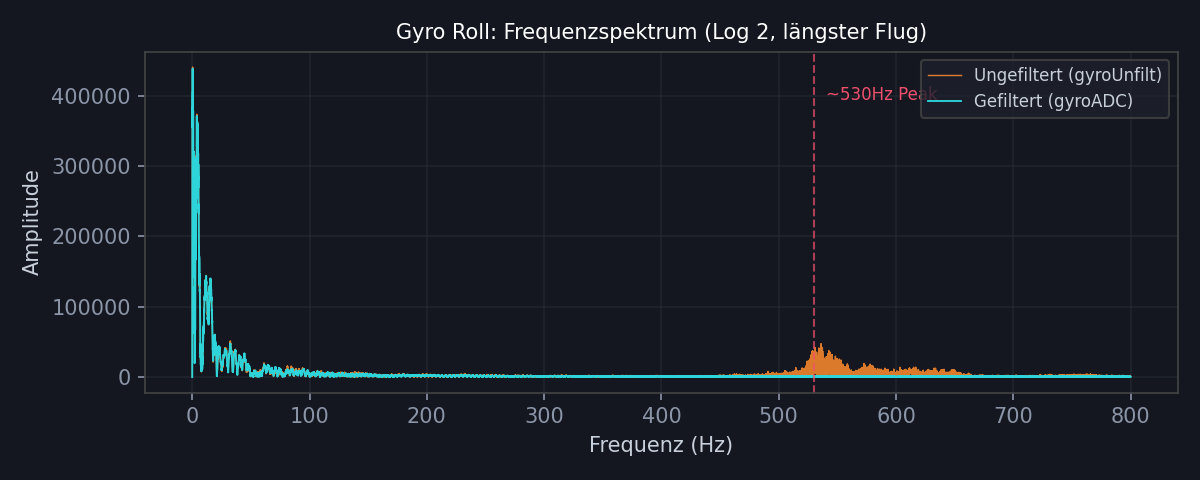
The orange bump at ~530 Hz in the unfiltered signal has no counterpart in the filtered (turquoise) signal — the filter barely catches it. Almost identical on all 3 axes, well above the chirp test range (up to 60 Hz) — so a real noise phenomenon independent of the test.
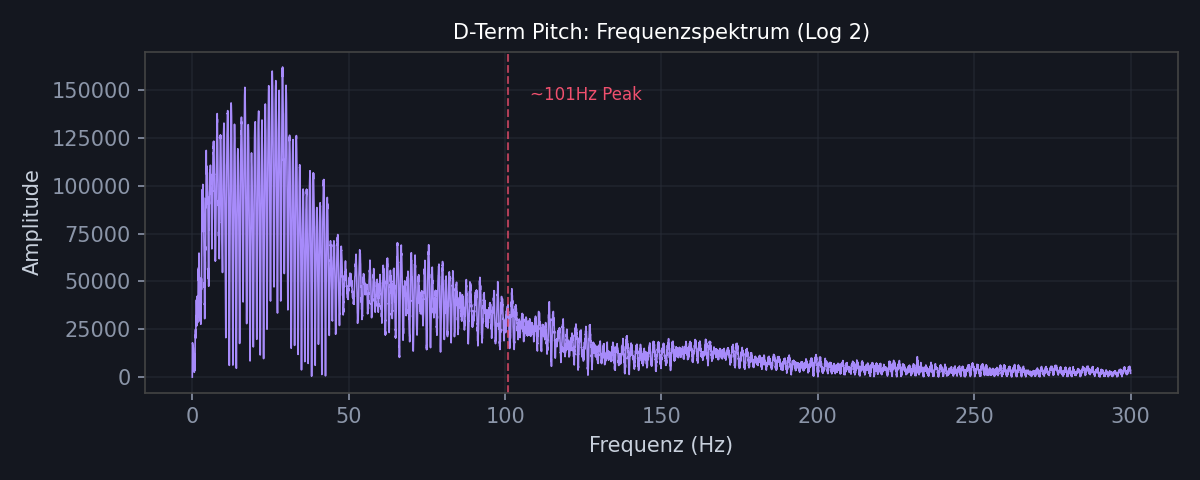
A D-term resonance peak initially suspected at ~101 Hz turned out on closer inspection to be a chirp test artefact: the elevated activity coincides with the chirp test frequency range itself (up to 60 Hz) — that is the expected system response to the test signal, not a filter problem of its own. This correction was transparently retracted rather than leaving an unfounded filter change in place.
Further statistical findings
| Finding | Value | Assessment |
|---|---|---|
| Effective PID loop rate | ~1969 Hz | Should be ~8000 Hz (found: pid_process_denom=2) |
| Yaw noise reduction by filters | 1-8% | Consistently the weakest of all 3 axes |
| Motor saturation (all motors) | <5% | No sign of fundamentally too-aggressive PID values |
Double verification
A second, independent CLI dump was uploaded later and compared with the original — all PID and filter values matched exactly. That confirmed the analysis had been based on the correct starting configuration all along. Details in the Betaflight tuning history (v6.0/v7.0).
Downloads
Not every FFT anomaly means a real tuning problem — some patterns are artefacts of the test method itself. That distinction was decisive here.